That project uses resampling methods, such as train/test dataset cuts or bootstrap to estimate the to be predicted qualities of an observation.
It has been noticed that a difference can be made between outliers and extreme observations depeding on the number of times this observation is in the train dataset:
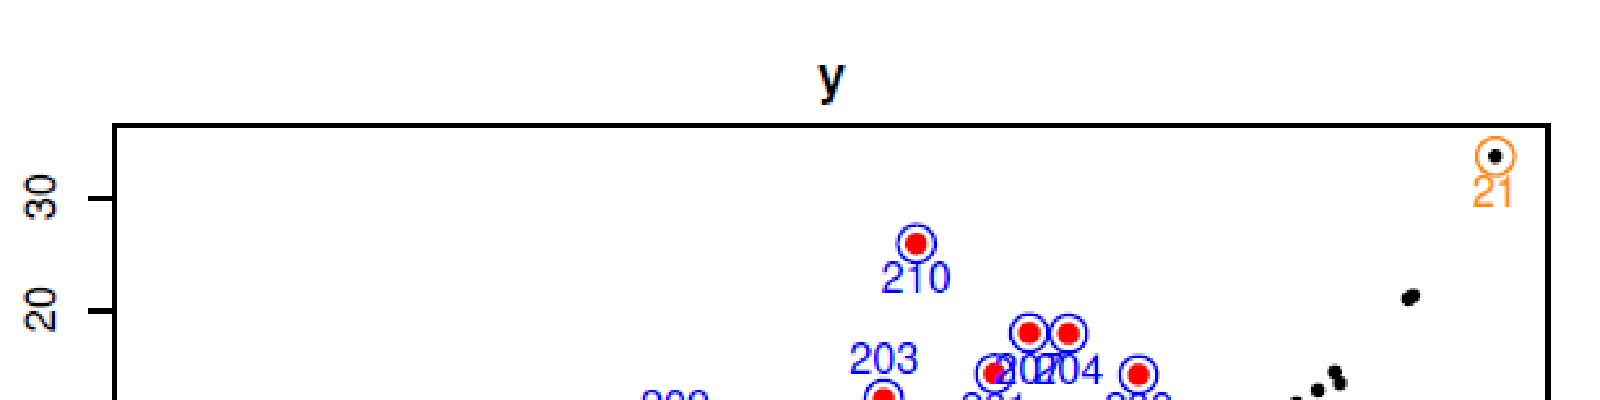
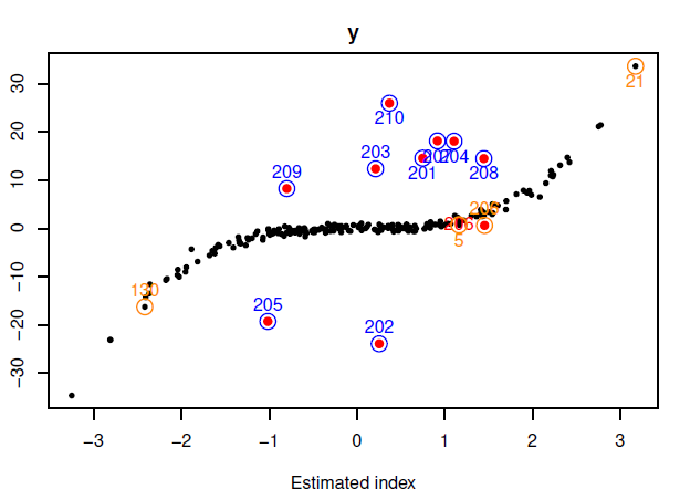
- Outliers are defined by bad predictions whatever the number of times thez do appear in the dataset.
- Extreme observations are defined by bad predictions if they are not present in the train dataset but with good predictions as soon as they are present at least once in the train dataset.
A package has been developped on GitHub (outlierSIR) to detect outliers with sampling methods. It is possible to use 3 different approaches:
- MONO, where prediction errors are computed on the all dataset thanks to a model built on the all dataset.
- TTR, the all dataset is cut in 2 parts (Train and Test). A model is built on the Train dataset and errors are computed on the Test dataset. This process is performed through many Replications. So the name TTR, Train-Test-Replications.
- BOOT, models are built on bootstrap samples of the all dataset and errors are computed on the all dataset.
This work is done with Jérôme Saracco.